

You might be interested


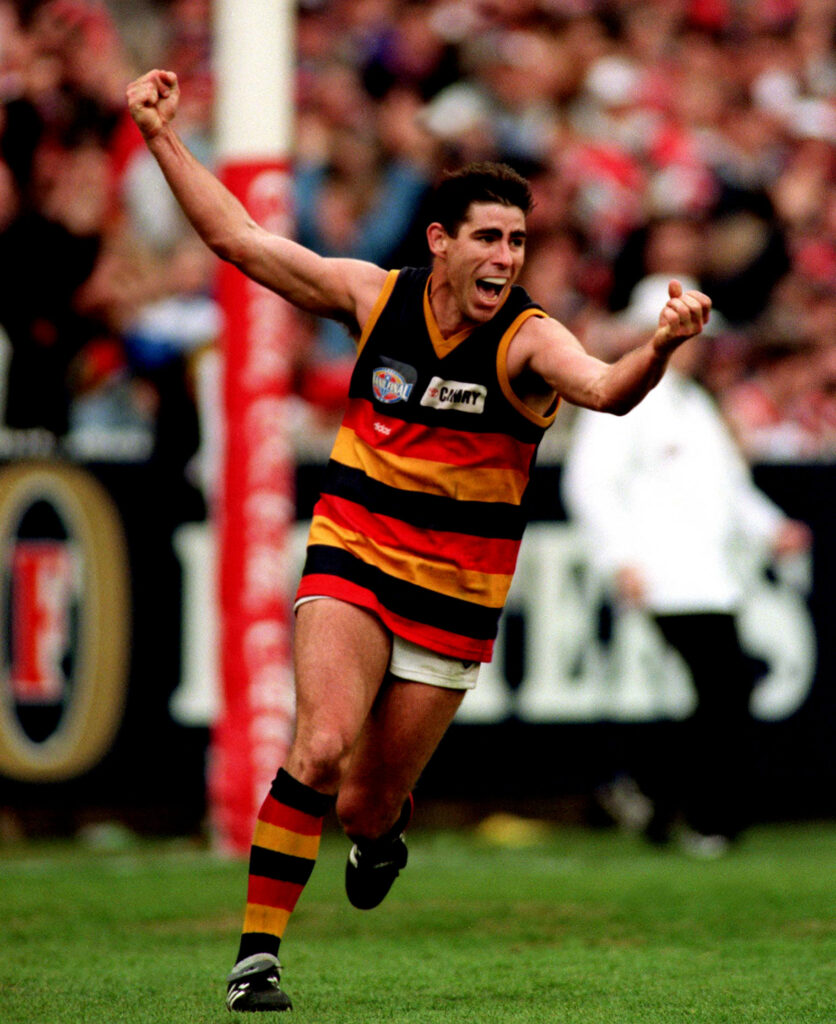
When Darren Jarman kicked an astounding five goals in the last quarter of the 1997 AFL Grand Final, I was 8 years old.
Today, Jarman’s haul would be analysed to within an inch of its life. But in 1997, the AFL’s data collecting was fairly basic.
In 1999, the AFL established a system to track a range of performance and statistical measures via its official data partner, Champion Data. That ushered in a new era for analysing and critiquing player and team performance.
Post-game write-ups before then show a few dozen statistics. Kicks, handballs, tackles, goals – but not a whole lot more.
Today, a standard AFL game assesses more than 200 technical performance indicators for every player.
That’s not to mention other stats tracked on team performance, taking the tally closer to 1,800 metrics recorded every match day.
“You’re looking at well over a million pieces of data,” says Dan Dwyer, a sports data scientist at Deakin University who works with AFL teams.
Data, data, data
AFL has been called the most data-rich game in the world, and Dan says it’s right at the top in terms of “volume and sophistication”.
There’s a truly staggering amount of information recorded every match – the kicks and handballs and tackles are just the basic stuff.
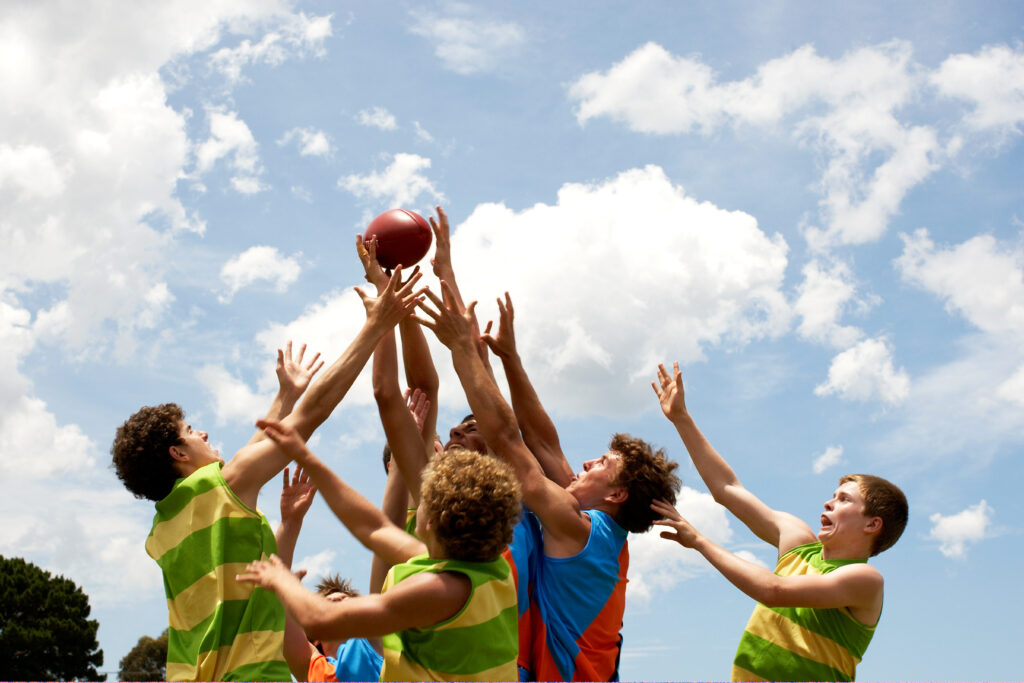
Credit: Cameron Spencer/Getty Images
There are also metrics like contested knock-ons and pressure act (corralling). Those new measures aim to provide more granular information on how a game is impacted.
It goes beyond recording the number of technical performance indicators. The AFL’s data provider is tracking where those actions took place and what their outcomes were.
This is all thanks to crack teams of statisticians who spend their weekends glued to footy games. They feed this data to coaches, commentators, betting agencies and fans, giving live updates on how the game is unfolding.
Big data energy
On game day, some people focus on the players, while others are locked in on umpires to track information like free kicks. Everything is fed into a bespoke computer program.
Player positions are also tracked across the ground, with GPS and LPS (local positioning system).
“They’ve got a small piece of technology mounted in their jersey between their shoulder blades,” says Dan.
“That’s collecting hundreds of thousands of pieces of data about their movement, location, velocity, distance and acceleration throughout the game.”
Those live stats are complemented by statisticians working in Champion Data’s Melbourne headquarters, who track more complicated statistics and double check the ones on-ground statisticians have already recorded.
Once the final siren sounds, the big data analysis begins.
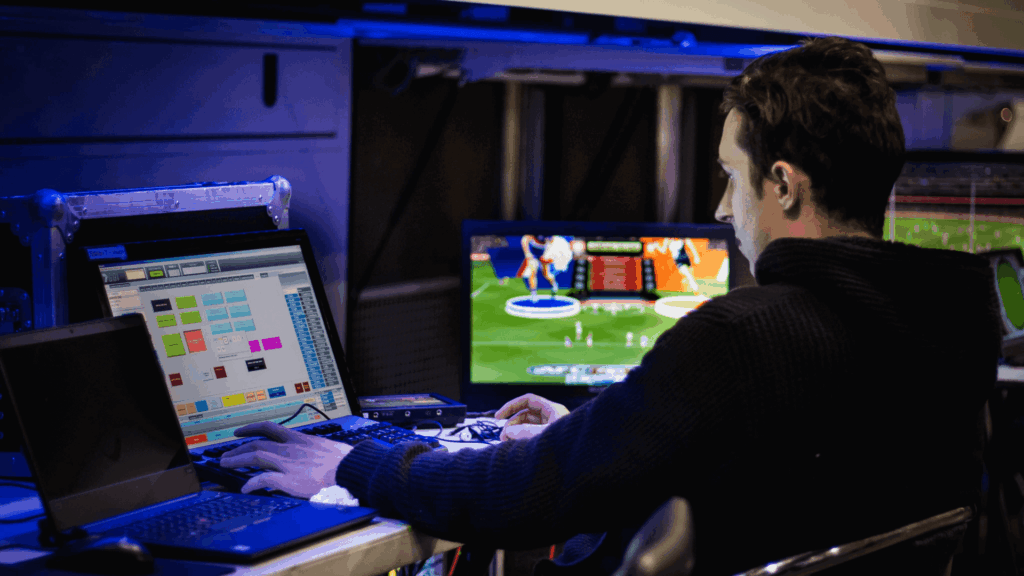
Credit: via Champion Data
Beyond the game
In the world of elite sport, science and big data can help to sharpen the tiniest competitive edge.
Sports data scientists like Dan work with massive datasets collected across the competition over the last few decades. Analysing and interpreting this data helps teams to understand historical trends, identify emerging challenges and tactics and determine how they can better prepare players for a game or recover from injury.
A 2021 review assessed the total distance players run each game, attempting to quantify how this affects performance based on sensor data collected over many years of research.
Another study in 2022 looked at the GPS and technical statistics from 32 players across 19 games, revealing how physically demanding different phases of the game were. These findings can guide training design and the loads players experience before big games.
These studies help teams decide how best to implement strategies against particular opponents or help select the best players every weekend.
Sometimes, alongside coaches’ opinions and evaluations, player data is even used to determine which players will receive a new contract and who won’t.
Big data might still have trouble predicting how Darren Jarman could snag five goals in the final quarter (I won’t stop about this).
But it’s likely to soon play a key role as machine learning and artificial intelligence (AI) help teams, coaches and players make decisions that could literally change the game.
Credit: Allsport Australia/Getty Images
Future data
A lot happens during an AFL game.
“Coaches have this exquisitely complex puzzle to solve every minute of the game, based on what they’re seeing through the window of the coaches’ box,” says Dan.
He heard a consistent message after interviewing a range of coaches: they are routinely overwhelmed by the amount of information they receive.
Dan and his team have developed an AI tool that can help coaches make decisions in the game in real time.
Known as the Coach’s Decision Assistant (CoDA), it can suggest how coaches might change up their strategy.
CoDA’s like a critical friend, Dan says. It can provide feedback by rapidly assessing data from a game, then review similar games across the competition’s history to plan a strategy. Did Team A win from four goals down? How did they change their strategy? What was the key to victory? Then it can provide some insights – which the coach can use or ignore.
Two AFL clubs used CoDA for half a season. This has helped to evaluate the tool and refine it for the future, Dan says, but it’s not quite ready for primetime yet.
Importantly, there are still human advantages to consider. “That’s an absolute rule for me,” says Dan. “The humans, still, are ultimately in control but they’re assisted by AI.”
Intuition – nearly impossible to measure – as well as knowledge and experience can help make crucial decisions during a game. But CoDA might help reduce the mental load of overwhelmed coaches and support their decision making.
Could AI have predicted Darren Jarman would kick five goals in the 1997 AFL Grand Final and flip the game on its head? Probably not. Sometimes, elite sports are about more than the numbers.
But it’s undeniable that science and big data has changed footy for the better, providing new insights, strategies and tactics.
That’s a win for fans. The standards rise, the games get more competitive and victory tastes even sweeter.

